Mainer Creates Go to Website When There is a Power Outage in the U.S.
It started out as a side project to track storms and the power outages they create across the country. Now, it's a trusted source.
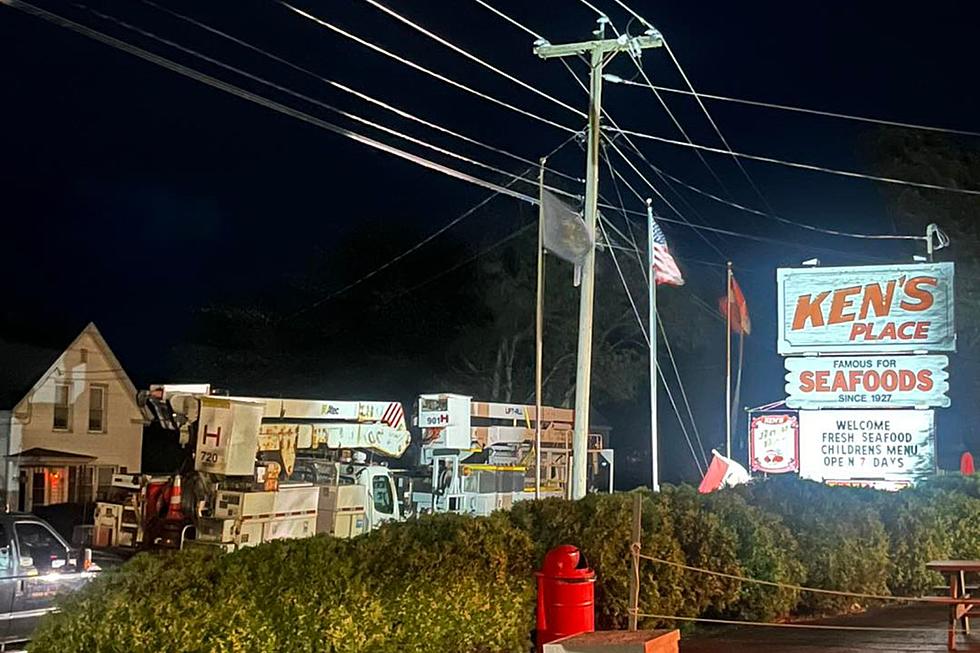
According to a recent interview with Accuweather, Jason Robinson from Portland had his first big test back in 2017 when Hurricane Irma knocked out electricity to more than 1 million customers..and that was just the start of outages. Way up in Portland, Jason was able to track and show the hardest hit areas. Hurricane Irma has been the biggest storm PowerOutage.US has tracked after 7.6 million customers lost electricity.
Who uses PowerOutages.US?
After Hurricane Imra, which killed nearly 130 people in three states, with many associated with the loss of power, many started to trust PowerOutages.US as their source to tell them where it's bad. It's a must for news organizations, emergency management agencies and even the United States military.

How did PowerOutages.US start?
Jason has always been interested in watching how storms move through power outages. He has a history of IT work and noticed there was no place to view all the information he was looking at in one place. So, he set out to create one. It really started as a fun side project for him. Learning about the technology and then - it took off!
How does PowereOutages.US work?
According to Jason, the website tracks power outages from more than 650 utilities across the U.S. It takes the data from these utilities and has to rely on them for accuracy. It's one of the most complete sources of power outage information currently available. He told Accuweather, that the system mostly runs by itself, but he monitors and checks the data for integrity issues, like any inconsistencies in the data sent from power utilities.
It's been a huge help to utilities too, because their websites can be overloaded and either slow or brought down by all the use during storms. The most recent large-scale power outage was in Texas during their power crisis which saw almost 4 and a half million people without power. It was brutal and to this day Jason is still gathering data from that crisis.
Next for Jason...he's trying to expand to cover the United Kingdom!
LOOK: The most expensive weather and climate disasters in recent decades
Gallery Credit: KATELYN LEBOFF
CHECK IT OUT: See the 100 most popular brands in America
More From 102.9 WBLM